Download, explore and view locations of urban trees in Edinburgh and Leeds in the 1890s.
Urban trees in Leeds and Edinburgh (1890s)
This dataset contains the point locations of coniferous and broadleaved tree symbols identified on 1:500 scale Ordnance Survey maps of Leeds (surveyed in 1888-91) and Edinburgh (surveyed in 1893-94) detected using machine learning methods.
The data was created by Elle Smith (University of Leeds) as part of her PhD project entitled ‘Urban Forests through Space and Time’. Elle’s PhD is funded by the National Environment Research Council (NERC) through the SENSE CDT and is a collaboration between the University of Leeds, University of Edinburgh and Forest Research as well as the National Library of Scotland.
Ordnance Survey large-scale town plans
Between the 1840s and the 1890s, Ordnance Survey mapped all towns in Britain at uniquely detailed scales of 1:1,056 (Five feet to the mile) and 1:500 (Ten feet to the mile). All settlements with more than 4,000 inhabitants were included, so the town plans eventually covered more than 500 towns across England, Scotland and Wales. The maps provide an extremely rich record of urban areas in Victorian Britain, including residential and industrial buildings, railway and transport infrastructure, the interiors of public buildings, as well as all ward and municipal boundaries. The exact position of free standing trees, as well as the location of clusters of trees and woodland are also clearly depicted, along with the layout of gardens. Edinburgh is covered by 185 sheets, whilst Leeds is covered by 138 sheets.
View Ordnance Survey large-scale town plans on the National Library of Scotland Maps website:
Ordnance Survey large-scale town plans for Scotland
Ordnance Survey large-scale town plans for England and Wales
Purpose
The purpose of this research is to examine how trees in urban areas (also known as urban forests), have changed over time, specifically looking at Leeds and Edinburgh. The project aims to identify how the benefits trees have provided to these two cities has been impacted by changes in their urban forests. Researching past urban forests and how they have changed over time can help us understand the urban forests we have today. This understanding can help us in future tree planning to prevent mistakes being repeated and to maximise benefits provided by urban trees1.
Methodology
A convolutional neural network (CNN) was trained to carry out object detection across the maps. Object detection locates and classifies instances of an object in an image, identifying them with a bounding box2. The CNN was trained to differentiate between coniferous and broadleaved tree symbols and was run over all map sheets for Leeds and Edinburgh. The location of each tree symbol was taken as the centre of the bounding box identified by the CNN. Additionally, the tree symbols have been classified as small, medium, and large.
Urban Trees: Visualising OS 1:500 data (1888-1894) viewer

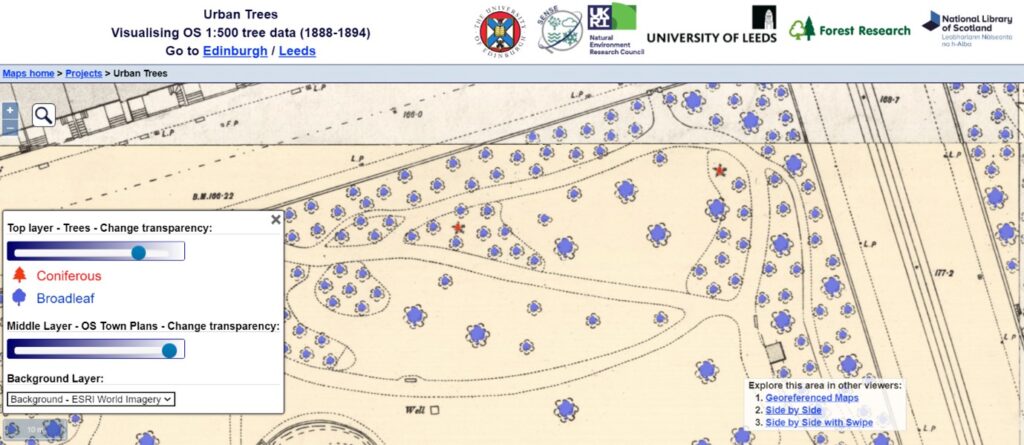
Screenshot of Urban Trees viewer: The viewer overlays the tree data on top of georeferenced Ordnance Survey historic town plans for Leeds and Edinburgh, colour coding the coniferous and broadleaf tree symbols. It is also possible to click on any coloured tree symbol to view the specific data for each tree.
About the data
The data is provided as two csv files – one for each city.
The columns in the files are:
- score – the score (confidence) of the detection.
- class – if the detection is classed as a tree (broadleaf) or conifer.
- area – the area of the detected bounding box.
- size – the size label applied to the detection.
- lat – latitude of tree location (WGS 84).
- lon – longitude of tree location (WGS 84).
- lat_bng – y value of location in British National Grid (OSGB36).
- lon_bng – x value of location in British National Grid (OSGB36).
In this study, 193,391 tree symbols were extracted collectively across both cities:
| City | Area covered by maps (ha) | Broadleaf detections | Conifer detections | Total detections |
| Leeds | 2144.52 | 78739 | 1109 | 79848 |
| Edinburgh | 2874.90 | 96602 | 17481 | 114083 |
| Overall totals | 5019.42 | 175341 | 18590 | 193931 |
View the data
This data has been visualised on the National Library of Scotland maps website’s Urban trees viewer.
Rights information

This data collection is licensed under a CC-BY 4.0 license.
The default re-use terms for NLS maps are CC-BY 4.0 but please refer to our information page about reuse of maps for more information.
Download the data
Urban Trees data
Download the Urban Trees datasets as CSV files from Zenodo.
Further information
Smith, et al. Estimating the density of urban trees in 1890s Leeds and Edinburgh using object detection on historical maps , Computers, Environment and Urban Systems. https://doi.org/10.1016/j.compenvurbsys.2024.102219
For access to the code used to carry out the object detection, see the following GitHub repositories:
https://github.com/ellesmith88/fr-trees-train/tree/1.0.1
https://github.com/ellesmith88/fr-trees-inference/tree/1.0.0
References
1. Deng, J., Xuan, X., Wang, W., Li, Z., Yao, H. and Wang, Z. 2020. ‘A review of research on object detection based on deep learning’. Journal of Physics: Conference Series. 1684(1), p.012028.
2. Nowak, D. 1993. ‘Historical Vegetation Change in Oakland and Its Implications for Urban Forest Management’. Arboriculture & Urban Forestry. 19(5), pp.313–319.