Chris Fleet (National Library of Scotland) describes a collaborative project to trace boundary data from nineteenth century maps of Edinburgh.
Creating boundaries
This project aimed to trace and make available useful boundary polygons from a set of nineteenth century maps of Edinburgh. It was a collaborative project between the School of History, Classics and Archaeology at the University of Edinburgh, and the National Library of Scotland.
The wider aims of the work were to:
1. develop easy-to-use tools to integrate historical maps and data in new applications, particularly for ‘amateur’ historians, local history societies and organisations.
2. create new tools to visualise geographical knowledge through an interactive website.
3. enable a large online and international public to access and explore historical information relating to 19th and 20th century Edinburgh through simple, graphical web applications.
There were two main stages to creating the boundaries. First, the identification and georeferencing of suitable maps showing boundaries, and second, the tracing the boundaries. The final stage set up the boundaries for viewing in a dynamic web-mapping application.
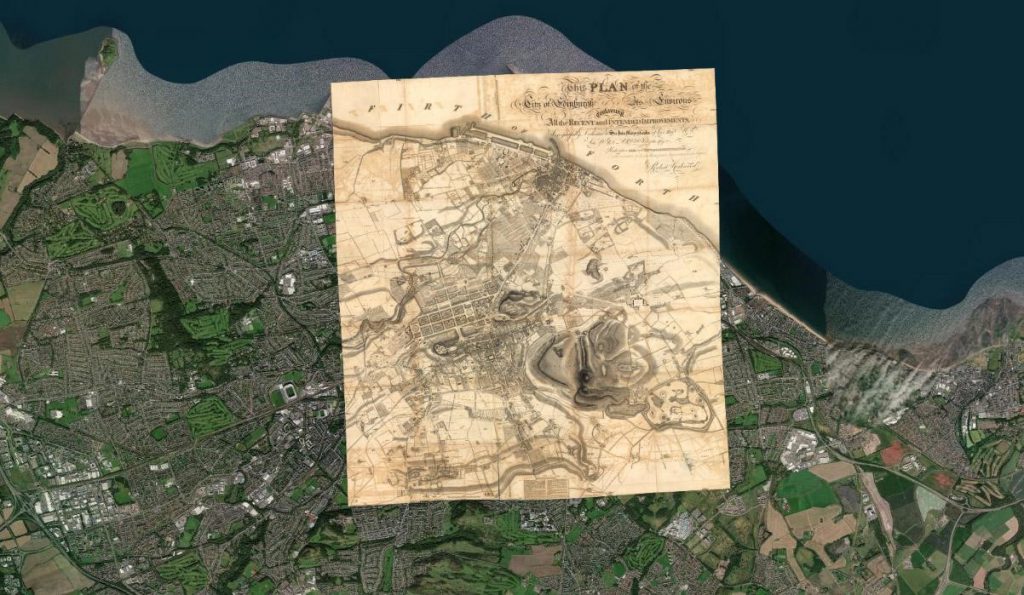
Identifying and georeferencing maps
The two most detailed maps of Edinburgh in the early 19th century, by John Ainslie (1804) and Robert Kirkwood (1817), have long been valued as uniquely important cadastral maps, showing land-ownership. The project was also able to take advantage of the National Library of Scotland holding the archives of the important Edinburgh map-makers, W. & A.K. Johnston and John Bartholomew & Son, both of whom were involved in significant mapping work for Edinburgh Town Council. Through related research on maps of Edinburgh, a table was drawn up of the most useful maps illustrating municipal boundaries such as wards and registration districts.
View the table of maps illustrating municipal boundaries: Ward and District Timeline
The georeferencing methodology was as follows:
– cropping the non-geographic parts of the map (ie. removing the margins / blank areas beyond the map boundaries).
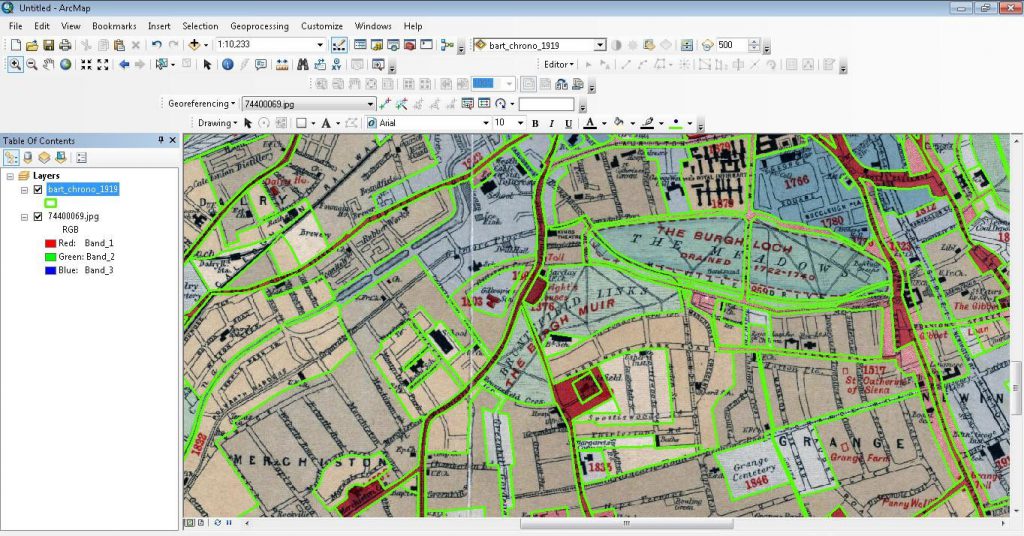
– opening the early map as an image in ArcGIS.
– adding Control Points / Link Points of known locations to image.
– transforming the map to the new position based on these control points.
As the purpose of the geo-referencing was to overlay other data on these maps, the objective was to fit the early map as closely as possible to the real world. This is in distinction to other types of geo-referencing for the purposes of map retrieval or examining geodetic accuracy. We generally chose the higher-order spline or adjust polynomial transformations for our purposes. The spline transformation, as a true rubber sheeting method, transforms the source control points exactly to target control points, and optimises for local accuracy, but not global accuracy. The adjust transformation uses a mixture of the spline and affine transformation, taking account of the control points within a broader context, so optimises for both global and local accuracy. Geo-referencing is an art as much as a science, and there was a need to experiment with different numbers of control points and these different transformations in order to achieve the best fit for particular maps.
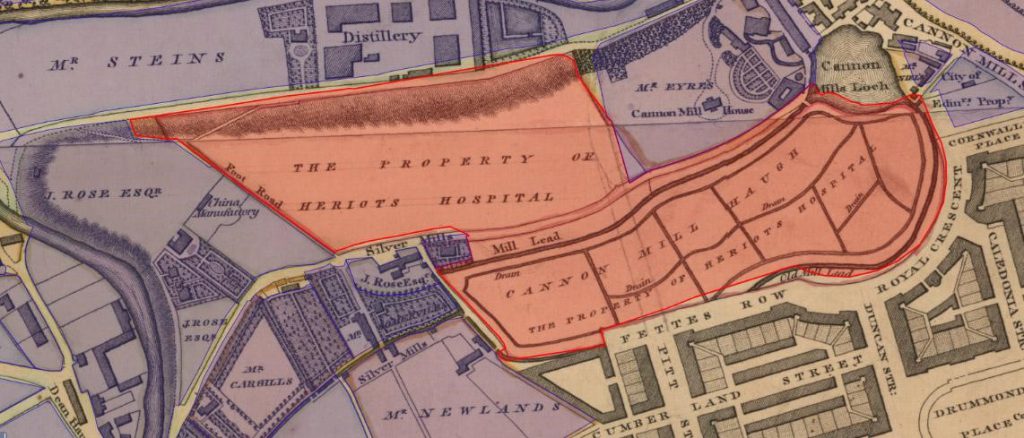
Tracing the boundaries
Our primary method for creating boundaries was to digitise the boundary region by manually tracing around the regions. The methodology was as follows:
– In ArcGIS we created the boundaries, or polygons, as shapefiles. To do this we created a Shapefile in ArcCatalog which was then opened in ArcMap as a new layer superimposed on one of our existing geo-referenced maps.
– Polygons were then traced around features identified on the raster map layer. Descriptive attributes were also added to the polygons.
– The finished shapefiles were then saved as KML and GeoJSON files for download. These two file formats present the data as single files in a web-ready format.
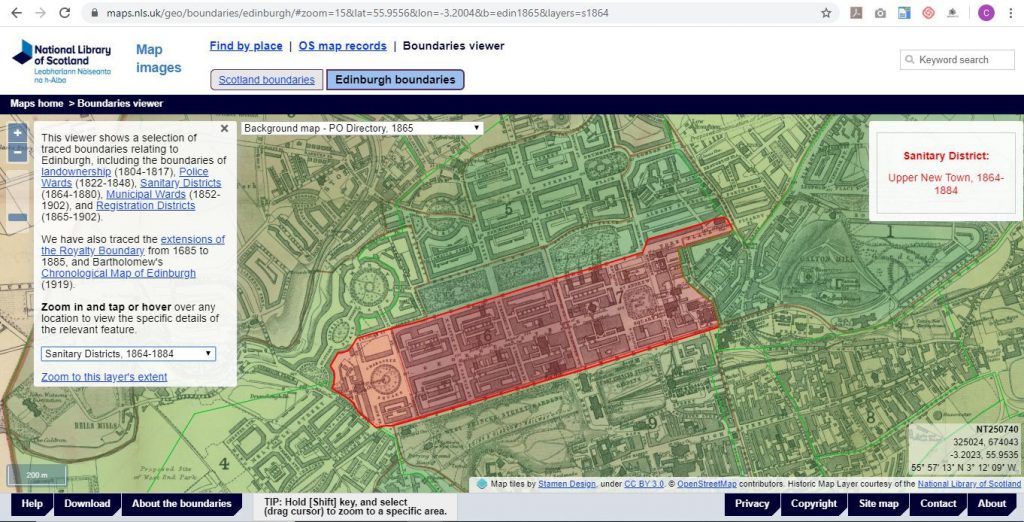
Setting up the boundaries in a web-mapping application
The Library has actively developed open-source map viewers on the Maps website. Free and widely used web-mapping applications such as OpenLayers and GeoServer form the basis of these applications.
We have shared the code behind our map viewers on GitHub, along with brief notes to guide their onward use. For the Edinburgh Boundaries viewer, we combined together three specific applications:
– Find by Place with GeoJSON – using the OpenLayers map.forEachFeatureAtPixel method to select polygon attributes, based on mouse hover over features
– Explore Georeferenced Maps – displaying the background georeferenced maps as XYZ tilesets, prepared with MapTiler.
– Explore Georeferenced Maps Plus – adding relating customisation, including the Permalink URL, and zoom to the layer extent functionality.
Find out more
Explore the map viewer: Edinburgh Boundaries viewer
Explore more mapping tools: Tools for viewing maps and geospatial data
Visit the Library’s Maps website: National Library of Scotland Maps Website
Which dataset did this project use?
This project created the Edinburgh Boundaries data: Edinburgh Boundaries on the Data Foundry website