Students taking the University of Edinburgh’s Data Science for Design course, run by Dr Benjamin Bach and Dr Dave Murray-Rust, have been using Library datasets to learn about, and create, data visualisations.
Visualising Encyclopaedia Britannica
Vaida Plankyte, Haonan Li and Wan Erh Hsieh used text mining techniques to extract and produce frequency counts of topics, and explore changes in time across the first eight editions of Encyclopaedia Britannica.
The group produced a website with data visualisations of the Encyclopaedias over time as well as a game. They also incorporated details from illustrations within the Encyclopaedias into the design, making for a visually-appealing exploration of this dataset.
Visit the website: Encyclopaedia Britannica data visualisation website
Explore the code: Encyclopaedia Britannica data visualisation GitHub pages
Encyclopaedia Britannica in Minecraft
Yifeng Gao, Bibo Tian and Xue Feng mapped their data analysis of Encyclopaedia Britannica into a Minecraft world, which you can explore on a rollercoaster. The world represents different aspects of the data, including the size of editions over time, prominent topics and author affiliations.
Spiritualist Newspapers and data comics
Ruyuan Zhang, Hang Yang and Xin Jin produced a data comic, presenting elements of the Spiritualist Newspapers collection as a story. This included exploring the frequency of male versus female names over time, and identifying well-known members of the Spiritualist movement in the nineteenth century.

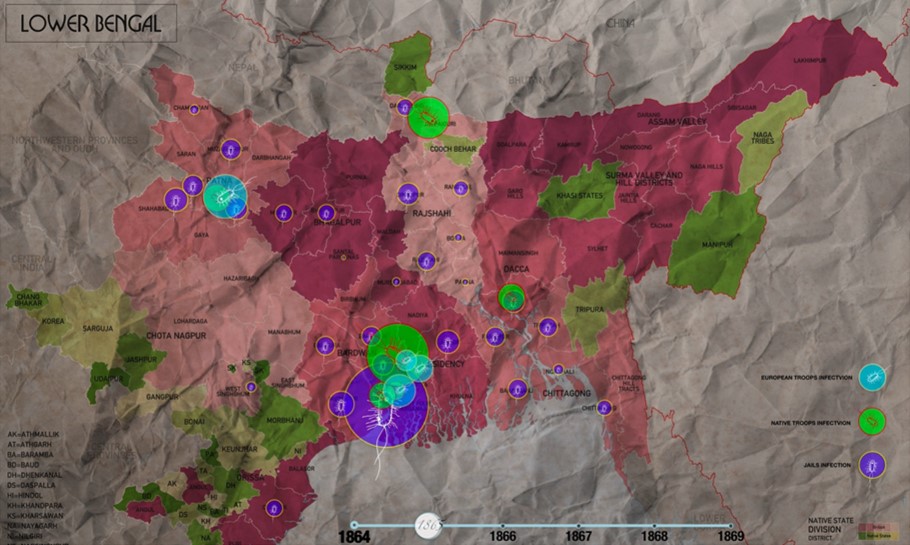
Visualising disease in British India
Qiubin Wu and Diwen Yu used the Medical History of British India dataset to explore the spread of disease in Bengal in the late nineteenth century and beginning of the twentieth century, as described by official government publications.
The project involved exploring the spread of disease and outbreaks of illness in prisons; amongst British troops; and within local communities.
Find out more
More information about the Data Fair: Data Fair 2019 website
Which datasets did these projects use?
These projects used Encyclopaedia Britannica, Spiritualist Newspapers and A Medical History of British India:
Encyclopaedia Britannica on the Data Foundry website
Spiritualist Newspapers on the Data Foundry website
A Medical History of British India on the Data Foundry website