Students taking the University of Edinburgh’s Data Science for Design course, run by Dr Benjamin Bach, have been using Library datasets to learn about, and create, data visualisations.
Visualising Scottish School Exam Papers
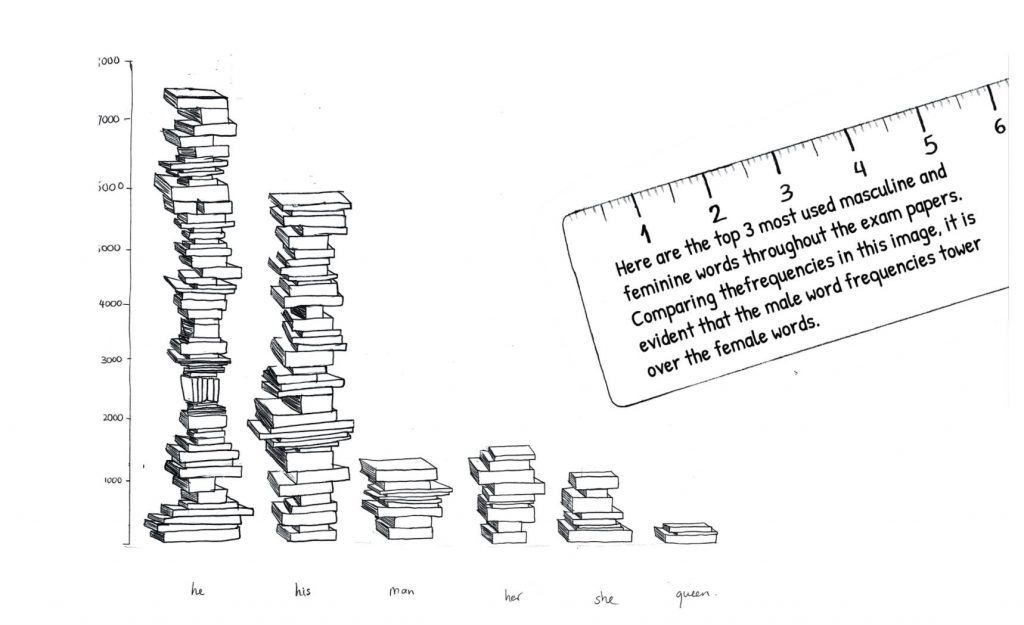
Anastasia Athanatou, Yidan Yuan, Yongchang Zhu, Jingyi Chu explored the Scottish School Exam Papers collection through different data visualisation techniques.
Their website, designed as a data comic, explores aspects of the Exam Papers, a dataset which spans the period 1888-1963, including the changes in topics which were examined over time, the locations referenced in the collections, the most popular author referenced in exam papers (can you guess who it is?) and gender bias in the way in which exam subjects have been historically communicated and assessed.
Visit the website: Scottish School Exam Papers data visualisation website
Britain and UK Handbooks as data visualisations
How does Britain represent itself to the outside world? Chloe Lei, Mingyang Dong, Svenja Vieker and Jenny Tang visualised the Britain and UK Handbooks collection, creating a website exploring word frequency and length of the handbooks over time.
The website also includes a quiz and a timeline providing historical context, as well as a map, explaining which areas were most frequently referenced.
Visit the website: Britain and UK Handbooks data visualisation website
Explore the code: Britain and UK Handbooks project GitLab pages
Spatial visualisation of Encyclopaedia Britannica
Students Yun Zhao, Xuanxuan Du, Ang Xu and Zhipei Li explore 100 years of Encyclopaedia Britannica. Their project has a particular focus on how different geographic regions were presented in the Encyclopaedia, and how this changed over time.
Their website also includes some overview statistics, such as word frequency counts and the longest word in each edition of the Encyclopaedia
Visit the website: Encyclopaedia Britannica data visualisation website
Explore the code: Encyclopaedia Britannica project GitHub pages
Find out more
More information about the Data Fair: Data Fair 2020 website
Which datasets did these projects use?
These projects used Encyclopaedia Britannica, Scottish School Exam Papers and Britain and UK Handbooks
Britain and UK Handbooks on the Data Foundry website